


Energy ETF Showdown: Comparing Performance of Different Energy Sources
Looking back at the performance of fossil fuel, solar power, wind and nuclear

A big theme in sustainable investing is renewable energy. Wind and solar power, in particular, have emerged as major players in the renewable energy landscape.
The performance of energy ETFs focused on these sectors becomes crucial because it reflects the growth and potential of these respective renewable energy investments.
In this week’s post, we will compare the performance of an ETF representative of traditional fossil fuel, a solar power ETF, a wind ETF and a nuclear ETF. Using PortfolioVisualizer, we can analyze their performance through time.
By understanding the historical performance of these ETFs, we can gauge the success and viability of renewable energy companies and projects, as well as capture the growth potential of each particular energy source.
Let’s begin!
The Contestants
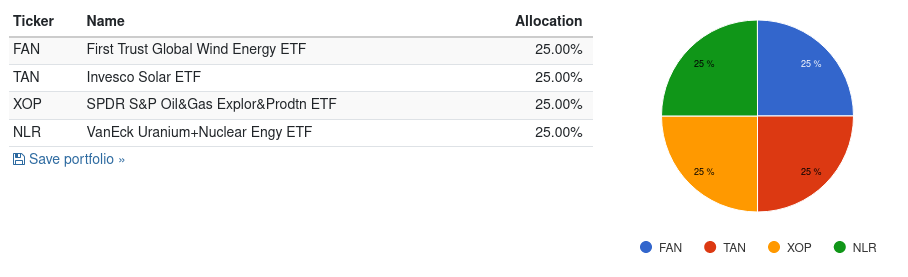
Here are the representative ETFs for each energy source:
First Trust Global Wind Energy ETF (FAN): Representative of companies in the wind energy sector. Top three holdings: Vestas Wind Systems (Denmark), Northland Power (Canada), EDP Renovaveis (Spain).
Invesco Solar ETF( TAN): Targets companies involved in the solar energy sector. Top three holdings: Enphase Energy (US), First Solar (US), SolarEdge Technologies (US).
VanEck Uranium + Nuclear Energy ETF (NLR): Focuses on companies in uranium mining and the nuclear energy industry. Top three holdings: PG&E (US), Constellation Energy (US), Public Service Enterprise Group (US).
SPDR Oil and Gas Exploration and Production ETF (XOP): Selects companies eneged in the exploration and production of oil and gas. Top three holdings: PBF Energy (US), Marathon Petroleum (US), Phillips 66 (US).
The list represents a showdown between renewable energy sources (FAN, TAN and NLR) and traditional fossil fuels (XOP).
In particular, the poor performance of FAN (Wind) and TAN (Solar) in 2023 has dominated headlines, but have they always been laggards?
If We Had $10,000 …
If we had $10,000 and allocate equally to these ETFs1, we see our portfolio’s value moving sideways, until 2020 where there was an explosive growth:
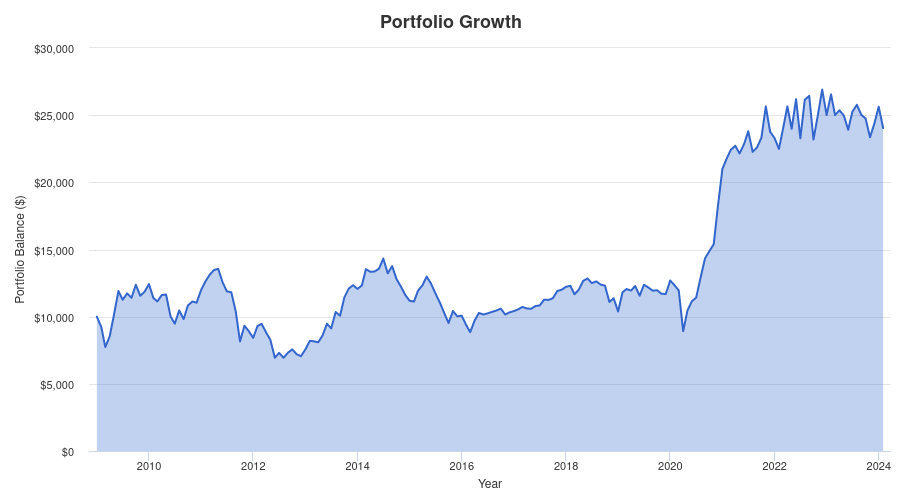
What drove this explosive growth? Surprise, surprise — TAN had an explosive 233.94% gain in 2020.
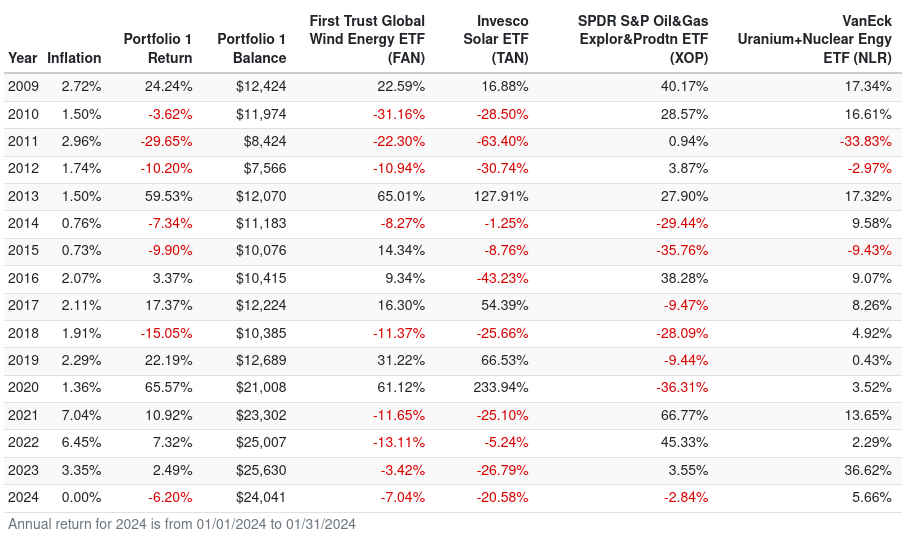
Interestingly, that was also the last year that both FAN and TAN saw a positive yearly gain. From 2021 onward, both ETFs languished, with TAN in particular suffering sharp losses.
This translates to a rather poor CAGR (Compound Annual Growth Rate) of -2.81% below over the analyzed period (from 2009 to Jan 2024):
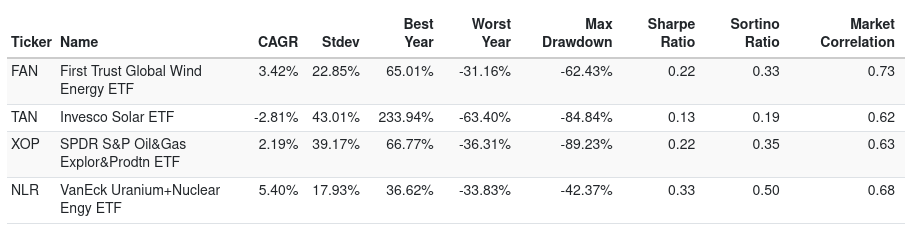
Not surprisingly, we also noticed the high volatility in TAN translating to a standard deviation of over 43%, with a max drawdown of -84.84%. This was, however, still slightly better than XOP’s 89% max drawdown.
If we really have to pick a winner here in terms of compound growth and low risk, NLR stood out, with a Sharpe ratio of 0.33.
Looking at the annual performance table above, NLR has chalked a string of straight gains since 2016, recording an outstanding return of 36.62% in 2023. The fact that NLR quietly outperforming was made more remarkable in a year where AI dominates almost all performance headlines. Even in the renewables space, media coverage has focused mostly on the poor performance of solar and wind power.
Looking at the monthly correlation table below, FAN and TAN have a correlation of 0.76, perhaps highlighting that companies in these two industries benefit from the same tailwinds (such as subsidies and favorable rulings) and hurt from similar trends (price pressures, failed environmental policies). This is perhaps not too surprising given they both represent the renewable energy sector.

What is interesting, however, is that NLR does not seem to have such a high correlation with FAN and TAN. Nuclear energy is a cleaner source of energy compared to fossil fuels, but has traditionally faced opposition over its adoption over safety and other industry concerns. The strong performance of the ETF itself, however, shoud speak volumes about the profitability of the sector.
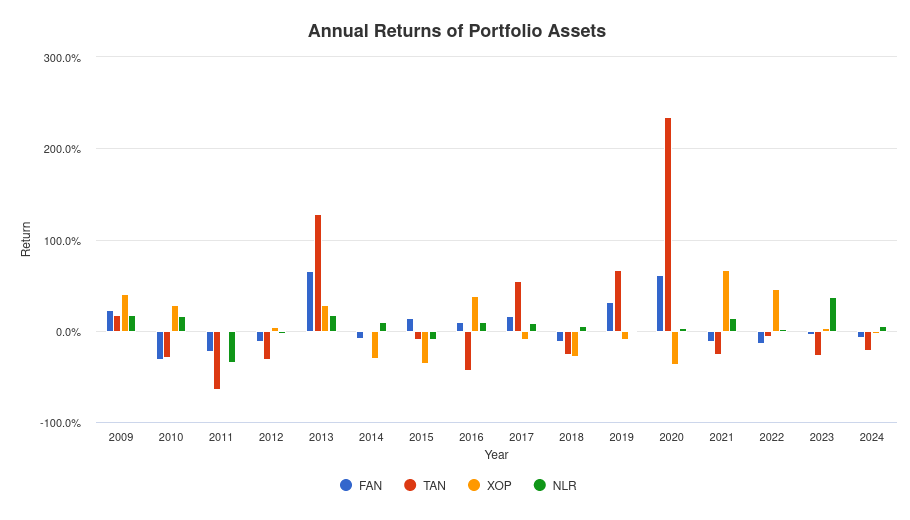
Here is a last chart looking at the annual returns (similar to the table above but in chart form). We see that it is rare that all four ETFs post gains at the same time (only happened in 2009 and 2013): When FAN and TAN do well, in general XOP does poorly (and vice versa). This fits with the clean energy versus fossil fuel narrative.
Summary
So what does it all mean? After years of poor performance, is 2024 the year that companies in FAN and TAN are cheap enough that we may see a rebound? Despite articles like these predicting a comeback, year-to-date performance seems to suggest that the sell-off is still ongoing (FAN is down 7% and TAN lost over 20% in January).
Or does NLR offer a better (read: more profitable) way of investing in a clean/renewable energy source? Past performance certainly seems to suggest so, and at current price level, it is some way from its peak of $120-130:

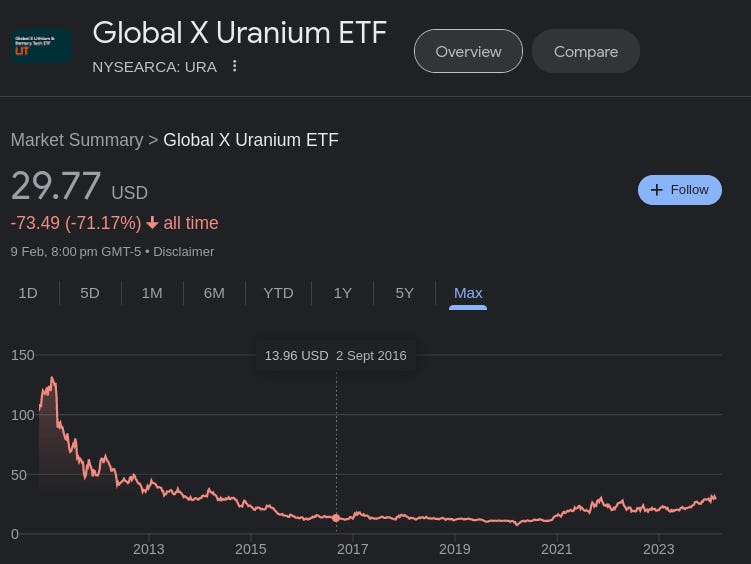
Which is a similar-looking chart to the Global X Uranium ETF, another popular vehicle for exposures to companies in the nuclear energy sector:
Of course, the purpose of this post is not to tell you which energy ETF to invest in, but rather just to showcase how volatile things can get.
What we remember now (recency bias) is that FAN and TAN both had a really horrible year in 2023, but let’s not forget that 2019 and 2020 were blockbuster years for them.
Unfortunately, if you had bought in after that, your investments would likely still be under water. So there is really no silver bullet here, except maybe to avoid the hype.
DISCLAIMER: The information provided here, including any historical data or performance of investments, is for informational purposes only and should not be considered as a guarantee or prediction of future investment results.
Assuming no rebalances here so we are just observing the growth of this $10,000 from 2009.