Happy Thursday! Welcome to this week’s Q-ESG newsletter.
What’s happening?
[1] EU eyes stricter rules for ESG data providers
Key players in the ESG data industry may have to spin off their ESG data business if proposed regulations in Europe become effective. These rules mark the first time that EU regulators are targeting companies that dish out ESG ratings.
Why this matters: After years of dominating the ESG data landscape, companies like S&P Global, Moody’s, Morningstar and MSCI may have to restructure their businesses to separate the ESG part of the business from their core businesses — such as providing credit ratings or selling indexing solutions — to avoid potential conflicts of interest.
ESG data providers may face a fine of up to 10% of annual turnover if they breach these new rules. Read more from Reuters here and the FT here (account may be required). Full press release from the European Commission is here, which also includes the introduction of a new set of taxonomy criteria.
Image by Grégory ROOSE from Pixabay
[2] S&P 500 Companies Talking Less About ESG
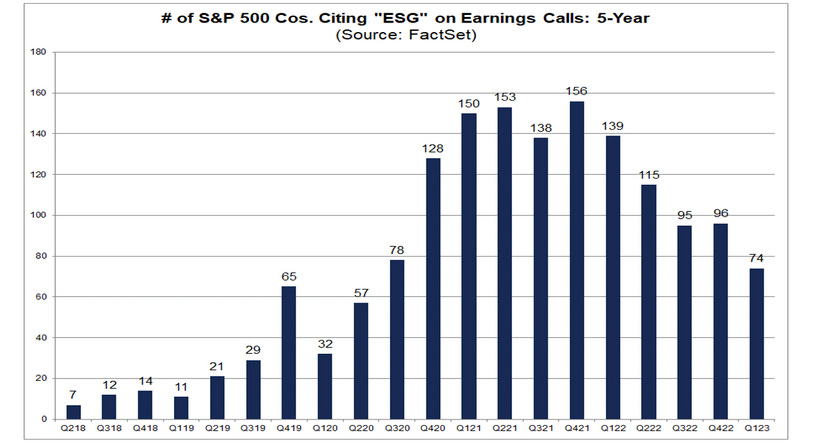
According to Factset, the number of companies citing the word “ESG” on earnings calls has declined. Only 74 cited the term during the latest earnings call.
Why this matters: It seems like companies are now paying less attention to ESG in their earnings transcripts. Just look at chart below showing the dwindling number since Q4 2021! What could be more important to companies than ESG now that they are talking less about it? Well, apparently it is … (drumroll) … AI (!!). Surprise, surprise. Read more here.
[3] Fund flows slow for “anti-ESG” funds: Morningstar
According to fund research firm Morningstar, funds that brand themselves as “anti-ESG” have seen slowing inflows.
Why this matters: Probably the best-known anti-ESG fund, Strive US Energy ETF saw its net inflows peak at $377 million in the third quarter of 2022. Since then, total net new deposits fell to $188 million in the last quarter of 2022 and then down to $183 million in the first three months of 2023. Combined inflows dropped further to $58 million in April and May. Read more from Reuters here.
Morningstar tracked 27 anti-ESG funds, which have total assets around $2.1 billion as of March 31. This pales in comparison to the $2.74 trillion classified as “sustainable assets”.
Explain to me like I am an eight-year-old
Scope 1,2 and 3 Carbon Emissions
You have a lemonade stand, and you're serving lemonade to customers. In doing so, certain activities release particles that are not good for the environment, which we call carbon emissions. There are three types of emissions: Scope 1, 2 and 3.Scope 1 emissions are the emissions that directly come from your lemonade stand. For example, if you use a machine that emits smoke or fumes while making lemonade, those are Scope 1 emissions.
Scope 2 comes from electricity you use at your lemonade stand. The emissions from the power plant generating that electricity would fall under this category.
Scope 3 comes from things you indirectly use or buy for the lemonade stand. For instance, the emissions released by vehicles that transport cups and straws to your lemonade stand are called Scope 3.
Books/papers/learning resources
Are Carbon Emissions Associated with Stock Returns?
(by Jitendra Aswani, Aneesh Raghunandan and Shivaram Rajgopal)
The argument for carbon risk goes: if you are a company that produces a lot of carbon emissions in the production of your goods and services, you are likely to face a higher cost of capital as banks, governments or any other liquidity providers become increasingly wary given there is more pressure now to go green. You may also face higher carbon taxes and have to fork out more for cleaning up.
Another argument works similar to a “sin premium”: due to shifting investors’ preference, you — a high-emiting firm — are now shunned by a certain subset of investors, leading to more attractive valuations, and investors who invest in your company should expect to earn excess returns to be compensated for the risk ( a “carbon premium”).
Either argument seems to suggest that carbon emissions and a company’s share price performance should therefore have some linkages. Say you identify a bucket of high-carbon companies, and you invest into them, you should either face higher carbon risk or benefit from the carbon premium, in theory.
Well, in theory. Not so if you look a bit deeper.
This paper first points out there have been “an emerging set of influential papers” that found strong associations between emissions and measures of firms’ financial performance. It then goes a step further to highlight how “specific research design choices” can significantly alter the conclusions. We will cover more about what this means below, but essentially what the authors are saying is that what you may call association between the two is in fact driven by other factors.
The two key takeaways for me from this paper are:
[1] Most companies still do not report carbon emissions data. To fill in the data gap, data vendors (such as Trucost used in the paper) rely on proprietary models to estimate emissions. This is the most interesting point for me from this paper, so I will quote directly from the authors here: “estimated emissions seem to be a nearly deterministic function of size, sales growth, industry, and time rather than capturing within-industry differences in carbon efficiency.”
This is significant because it means what we think as carbon emissions is in fact just a disguised output of a company’s industry, size, sales growth and other non-carbon factors. We are not really investing in companies with lower emissions — we are just shunning bigger companies in polluting industries that may have seen a more rapid sales growth that led to higher estimated emissions.
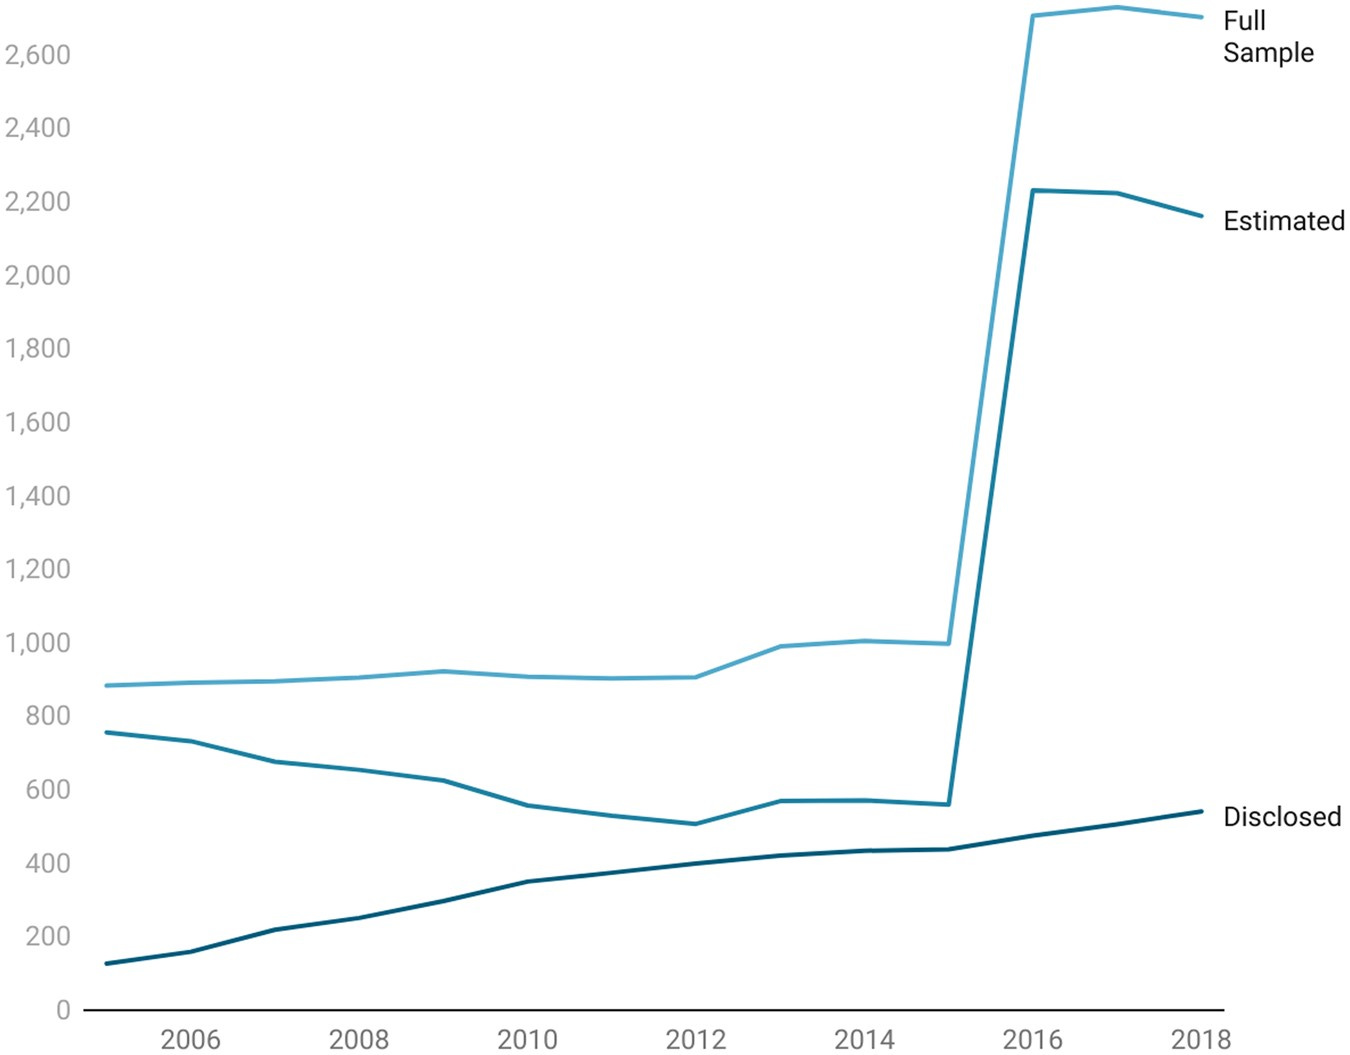
And when you look at the chart below, you will find that estimated emissions dominate the data landscape, as disclosure is still mostly voluntary.
Observations by year. This figure presents a breakdown of the number of firms by year, both in total and broken down into disclosed versus vendor-estimated scope 1 emissions figures.
[2] The authors also found significant difference between unscaled and scaled carbon emissions. Unscaled emissions refer to the absolute amount of emissions, whereas scaled emissions refer to emissions that are normalized based on a company’s size or sales. If company A is bigger than company B, and they are both from the same industry, it is likely that A’s unscaled emissions is larger as well, but their scaled emissions may be similar after adjusting for size.
While scaled emissions — also widely known as carbon intensity — may be a better gauge of a firm’s carbon-reduction efforts, they do not have significant explanatory powers on a company’s share price performance. In other words, the authors found no consistent evidence that supports a carbon premium when they switch to using scaled from unscaled emissions as the independent variable.
In summary, there are some important caveats here when we say carbon emissions are associated with stock returns.
A more accurate version would be yes, carbon emissions and stock returns are kind of associated, but only if you are talking about [1] using the natural logarithm of unscaled instead of scaled emissions; and [2] using estimated emissions instead of reported emissions. Since we are on the topic of estimated emissions, we should also highight that these likely just capture a company’s size, industry and sales growth instead of its carbon efficiency.
That’s a mouthful, isn’t it? Maybe it is just easier to say that yes, we found some evidence of a carbon premium. This goes back to the authors’ point about “specific research design choices”, you get different conclusions each time, depending on if you use scaled, unscaled, disclosed or estimated emissions data.
That is what the authors are cautioning against, actually:
Researchers, practitioners, and policymakers might want to be careful about interpreting statistical associations between carbon emissions and returns.
Read the full paper here.


