
Mindmapping Nat Bullard's 2024 Decarbonization Presentation
Useful to gain a deeper understanding of a subject matter as complex as decarbonization

In this week’s post, I will share my experience mindmapping Nat Bullard’s annual presentation on the state of decarbonization.
Nat is a former columnist at Bloomberg New Energy Finance and his annual presentation of decarbonization is a great resource packed with data and insights for anyone interested in the path to net zero. In Nat’s words: “A coherent view of the future begins with the clearest possible view of the present”.
Let’s begin!
Why Mindmap?
Nat’s presentation is jam-packed with great information and amazing charts and this post by Noah Smith did a great job covering some of the key charts.
Partly inspired by the infectious energy in this YouTube video, I decided to try to summarize Nat’s presentation in a mindmap format.
A mindmap is supposed to mimic how our brain visualize information and my hope is that by going through the process of mindmapping the presentation, it will help internalize some of the key points in the presentation and more easily observe the links between key trends in the field of decarbonization.
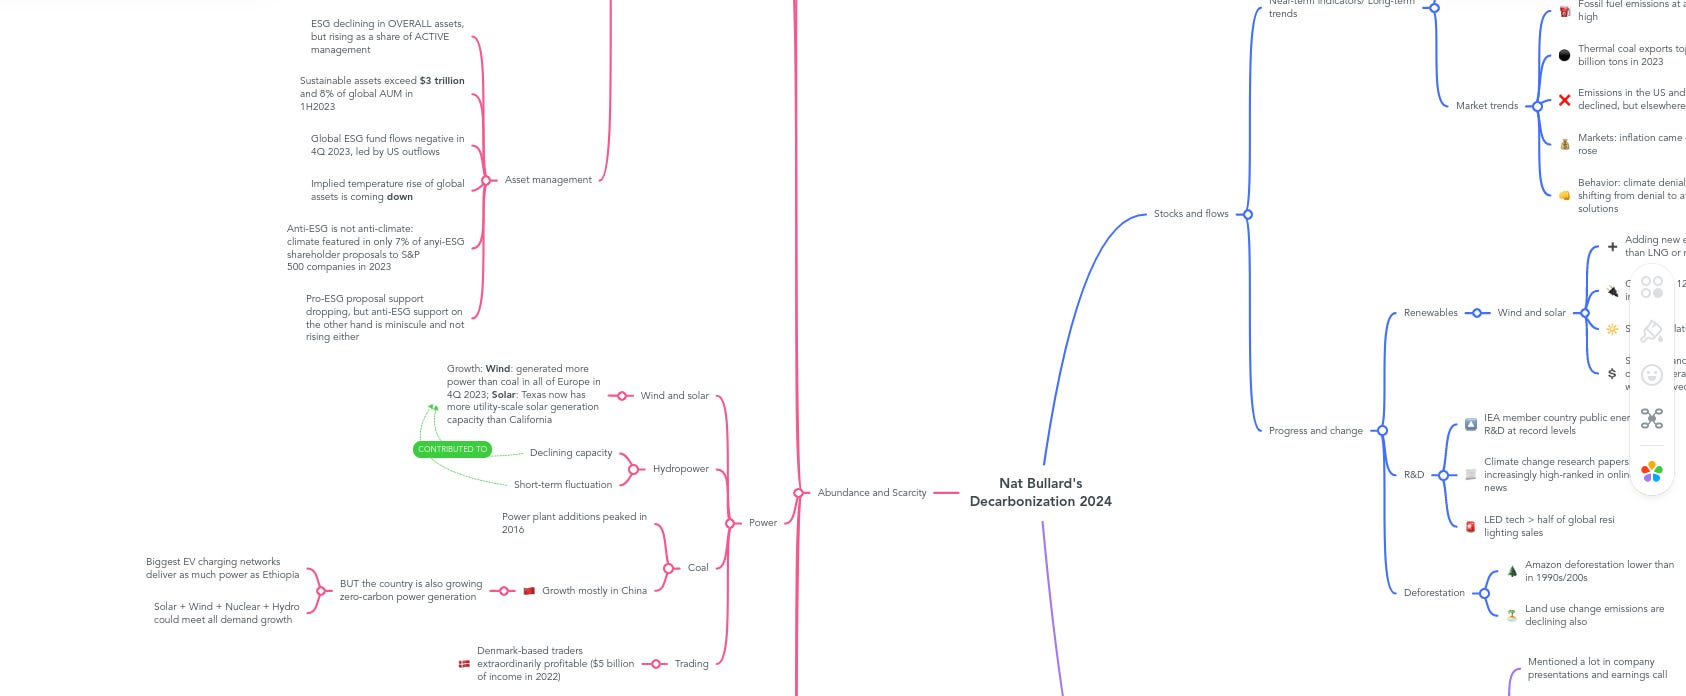
Nat’s presentation is separated into three main sections: Stocks and Flows, Abundance and Scarcity and Net Zero.
Stocks and Flows
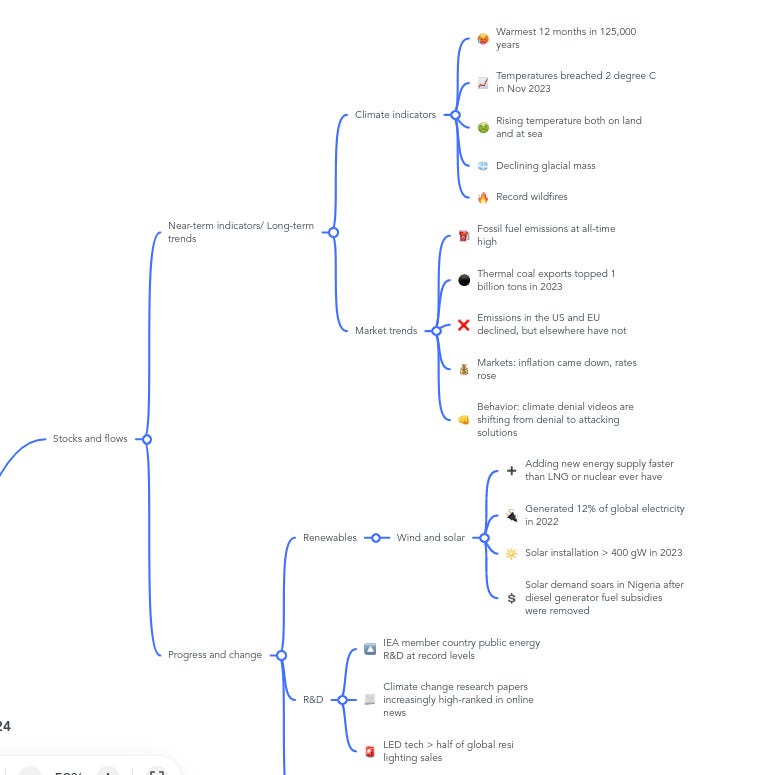
Near-term climate indicators show we are experiencing the following:
Warmest 12 months in 125,000 years
Temperatures breached 2 degree C in Nov 2023
Rising temperature both on land and at sea
Declining glacial mass
Record wildfires
Market trends, meanwhile, highlight that:
Fossil fuel emissions at all-time high
Thermal coal exports topped 1 billion tons in 2023
Emissions in the US and EU declined, but elsewhere have not
Markets: inflation came down, rates rose
Behavior: climate denial videos are shifting from denial to attacking solutions
These are depressing trends indeed, but we also witness progress and change in a few fields:
Renewables: Wind and solar are adding new energy supply faster than LNG or nuclear ever have
R&Ds: IEA member country public energy R&Ds are at record levels
Deforestation: Amazon deforestation is lower than in 1990s/2000s
Abundance and Scarcity
This is the meatiest section of the entire presentation, separated into the sub-sections of capital and markets, technology behaviors, commitments, power, the auto complex, molecules, abundance and scarcity.
I am not going to cover each section, but will just point out some interesting findings here:
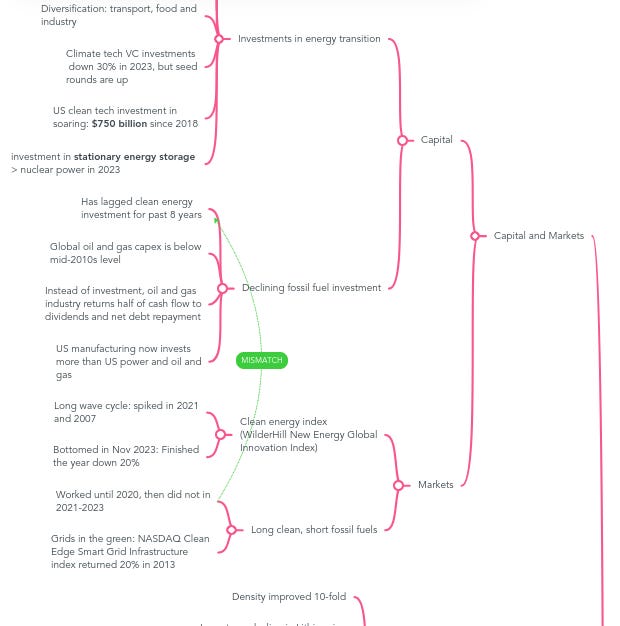
Investments in energy transition are rising (topped over $1.7 trillion in 2023), while investments in traditional fossil fuel are declining. Instead of investment, oil and gas industry now returns half of cash flow to dividends and paring down debt. US manufacturing now invests more than US power and US oil and gas.
However, this investment trend is not really reflected in markets. A long clean, short fossil fuel portfolio would worked in 2020, until it did not in 2021 to 2023, which is also reflected in this other post here.
Battery technology is rapidly improving. Rising density and installation coincide with a long-term decline in Lithium-ion battery prices. Major battery manufacturers are all in Asia (China’s CATL and BYD, Korea’s LG)
Similar trend in solar modules: efficiency up, prices down.
Major compliance carbon markets are now worth $800 billion.
ESG investing is declining in overall assets, but rising as a share of active management. Sustainable assets exceed $3 trillion and 8% of global AUM in 1H2023. However, as we know, global ESG fund flows have been negative in 2023, led by US outflows.
Wind and solar breakthrough: Wind power generated more power than coal in all of Europe in 4Q 2023. The rise in wind and solar coincides with the declining capacity and short-term fluctuations in hydropower.
China is an interesting one. Growth of coal power plants are mostly dominated by China, yet at the same time the country is massively growing its zero-carbon power generation. Its capacity in solar, wind, nuclear and hydro can now meet demand growth.
EV sales globally remain strong: 34% growth in 2023; 14 million units sold worldwide. EVs can displace oil demand by 2 million barrels per day.
China’s BYD sold more passenger BEVs than Tesla in 4Q 2023. Ford’s challenges in this space is well highlighted by media, but the sales narrative may have been biased as the data is more complex.
Lots of cheap EVs in China (in the <$30k range), unseen in the US or Europe
Moving to LNG, over 50% of global gas trade is now by ship, not by pipelines
US has overtaken Qatar to be world’s No. 1 LNG exporter. Interestingly, US is also now a net energy exporter, reversing decades of trend. Both US and Qatar are expected to add 200 million tons of capacity in next 10 years
What is abundant: Li-ion batteries, PV modules, standards and taxonomies, US grid connection queue (over 2 terawatts of potential power)
What is scarce: grid congestion in US and Europe, South Africa’s power supply, sustainable aviation fuel volume (only 1% of total consumption)
Net zero thought experiment
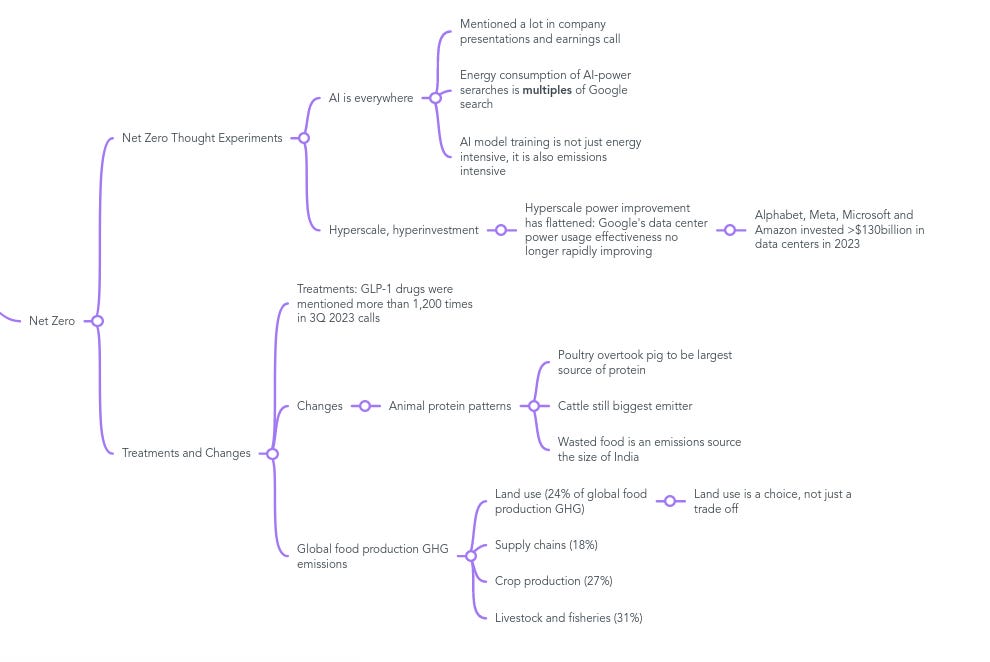
This section covers major emerging trends such as AI and GLP-1 drugs, which were both mentioned a lot in company earnings call and presentations.
Nat also highlights interesting changes in animal protein patterns, such as poultry overtaking pig to be the largest source of protein. Sadly, wasted food is also a major emissions source.
The presentation then goes back to Stocks and Flows, which encourages us to think in stocks and not just in flows. A change needed to accelerate decarbonization means mobilizing the substanial global wealth we have now ($250 trillion) and also to research, develop, deploy and scale.
Summary
So, did I learn anything useful from this exercise? Probably. For instance, summarizing the slides using a mindmap helps to uncover the relationship between rising battery efficiency and dropping prices, as well as the mismatch between the investments being poured into energy transition and the poor market performance of clean energy.
Another benefit of building a mindmap is to look at the presentation from a top-down view and have a better understanding of the author’s structuring of the content, instead of getting lost in the weeds of details.
One thing to note, however, is that this exercise was time consuming (took over ~3 hours), partially due to the breadth of content (as mentioned Nat’s presentation has 200 slides). That being said, I would encourage using mindmapping as a tool to gain a deeper understanding of a subject matter as complex as decarbonization.
And as always, if you want to dive deeper into the presentation (lots of details have been left out in the outlines above), the link is here. I am grateful that Nat has so graciously shared such useful content for free and it would definitely benefit anyone’s learning journey on the topic of decarbonization.
Disclaimer: This summary is based on my best efforts to capture the essence of the presentation. Any errors or inaccuracies in the summary are solely my responsibility and not reflective of the original author's work. If you would like a copy of the mindmap, please reach out.